


ISSN : 0976-7061
EISSN : 0976-707X



BERKÅ P.1*, JOUBERT K.2, GÃRDOS E.3, GYENIS G.4
1Faculty of Healthcare, Miskolc University, B.A.Z. County and University Teaching Hospital, Miskolc, Hungary.
2Demographic Research Institute, Hungarian Central Statistical Office, Budapest, Hungary.
3Hungarian Central Statistical Office, Budapest, Hungary.
4Department of Biological Anthropology, Faculty of Science, Eötvös Loránd University, Budapest, Hungary.
* Corresponding Author : berko.szulesz@bazmkorhaz.hu
Received : 24-07-2013 Accepted : 09-09-2013 Published : 09-10-2013
Volume : 4 Issue : 1 Pages : 61 - 64
J Clin Res Lett 4.1 (2013):61-64
DOI : http://dx.doi.org/10.9735/0976-7061.4.1.61-64
Conflict of Interest : None declared
It is not easy for pediatric endocrinologists to choose among methods and criteria for making the earliest possible decision on which children should be monitored due to growth retardation. Continual monitoring is needed for those children who have a high probability of requiring growth hormone therapy beginning from 2-4 years of age. This study analyzes the data of 6,335 male 18-year-old conscripts for whom birth data was also available. Using Berkő’s MDN system, it was found that 48% of those with the lowest weight and at the same time the lowest height at age 18 ranked as proportionally retarded at birth. Based on our data, we recommend that the physical development of those children identified at birth as being proportionally retarded on the MDN matrix, as well as those ranked next to them, be carefully monitored, since children in potential need of growth hormone therapy from the age of 4 belong primarily to this group.
MDN system, growth retardation, growth hormone therapy.
Our earlier research found that the birth weight and length developed intra-uterinally during a fetus or neonate’s growth, as well as the nutritional status, influences to a large extent the chance of survival, or intra-uterine and neonate mortality [1-5] . From this, we can hypothesize that those neonates belong to the least advantageous group in terms of development and nutrition are more likely to suffer from certain diseases. We can also suppose that unfavorable development and nutrition at birth has a negative effect on the rate and degree of later physical growth, for instance on gaining height. If this latter assumption is proven to be true, then it may be possible immediately after birth to separate out those neonates whose will require extra monitoring during their early childhood, since they may be in prospective need of beginning growth hormone therapy between ages 2 and 4.
At what age and how can we select those children who are more likely to require growth hormone therapy in order to reach at least an average height?
There are strictly set medical criteria for prescribing growth hormone therapy and there are also situations where parents request treatment because of their child’s predicted lack of height or due to the recommendation of doctors [6-9] . We wish to offer assistance in the latter case alone.
We are aware that one of the biggest dilemmas in growth hormone therapy is that of selecting children who, due to their unfavorable growth tendencies, are to be placed under strict monitoring and may need eventual hormone therapy: when should they be selected and based on what criteria? If we do not do this these children, then the chance increases that their adult height will not read the average height. In pediatric endocrinology the typical practice is to place under observation those 2 or 3 year old children who, over a period of 6-12 months, (i) show a value for their height below the 3rd percentile, (ii) are within the 10th percentile, if they were born with a weight and/or length below the 3rd percentile, or (iii) whose catch-up growth is insufficient and who do not reach the 10th percentile by age 2. These children are observed by endocrinologists and if their height remains below the 3rd percentile at age 4, hormone therapy is initiated.
Much effort is being put into identifying children in need of monitoring as early as possible. The MDN system is highly suitable for this purpose. We believe that the MDN system that we have developed [1-5] can aid in identifying prospective candidates for growth hormone therapy (typically starting at age 4) within just a few minutes of birth.
MDN system is a method of examination that can be used to determine the bodily development and nutritional status of a newborn and that permits the categorization of neonates. In it, the sex, gestational age, weight and length of the neonate are compared with weight and length standards for that sex and gestational age. Thus, the system makes it possible to separate out the neonate groups that are most at risk based on their development and nutrition.
If we want to determine both the bodily development and nutritional status of a newborn at the same time and with precision, then a 64-cell matrix can be used to classify the infant. This MDN matrix, which resembled a chess board, has 8 rows for the 8 zones most typically used for the standard weight of newborns for the given nation (below the 3rd percentile; 3rd-10th; 10th-25th; 25th-50th, 50th-75th, 75th-90th, 90th-97th and above the 97th percentile). The 8 columns show the eight standard length zones, divided similarly. Once we have the newborn’s gestational age, sex, weight and length, then by applying nation-specific weight and length standards each infant can be placed in one of the 64 cells of the MDN matrix.
In the bottom left-hand corner of the MDN matrix are the neonates whose birth weight and birth length are both below the 3rd percentile of the standards. They are the smallest and also proportional in terms of nutrition. In the upper right-hand corner are neonates whose weight and length are both over the 97th percentile. With the matrix, it is simple to distinguish newborns from each other and characterize them in terms of their bodily development and nutritional status.
In the central 4 cells we find the newborns who are “absolutely average” (AA), that is, who have average values for both weight and length. The lower left corner area contains the proportionally retarded (PR) neonates, with weight and length below the 10th percentile. The upper right corner sector contains the proportionally “overdeveloped” (POD) neonates (with weight and length over the 90th percentile). The triangle in the upper left of the matrix is for newborns who are either extremely overnourished (EON) or moderately overnourished (MON) in relation to their length, while the triangle in the bottom right represents extremely undernourished (EUN) and moderately undernourished (MUN) newborns considering their length. [Fig-1] shows an MDN matrix based on the distribution of data from neonates in Hungary between 1997 and 2003, while [Fig-2] shows the perinatal mortality rate for the same population.
Our answer is unequivocably “no”. We find it important to emphasize, since these days the SGA (small for gestational age) group is considered to contain the candidates for later growth hormone therapy. However, one glance at the MDN matrix will make it clear that newborns in the two weight zones below 10%, in the sector for SGA by weight (W-SGA) are, to a great extent, heterogeneous, also in terms of their length and nutritional status. The small neonates placed in the lower left-hand corner are those who proportionally retarded (PR). The disportionally retarded neonates are placed in the green triangle in the lower right-hand corner of the matrix. Some of them (those in the light-green cells) are moderately undernourished (MUN), the others (in the darker-green cells) are extremely undernourished (EUN). A smaller proportion of the disproportionally retarded infants are in the weight zone above (!) the 10th percentile; the majority of them are below it, within the W-SGA group. Apart from the group below the 10th percentile, there are also mixed-type infants within the light green zone. The same is true for the large group of infants rated as SGA based on length (L-SGA). They also fall into heterogeneous groups on the matrix. If the SGA group is in fact so heterogeneous, then it is quite likely that not every SGA neonate needs to be considered a potential candidate for growth hormone therapy. And so the question arises: how can we further narrow the group of those needing close observation and how can the MDN system assist in this process?
In this study we analyzed data from a national representative sample of 8,000 18-year-old male conscripts taken in 1998, ending up with 6,335 individuals whose official birth data was available [10-11] . We applied Berkő’s MDN system [4-5] , built upon Joubert’s standards for Hungarian neonates [2] , in order to investigate the effect of position on the MDN matrix at birth on height at age 18 and more particularly, to find the average adult height of those individuals belonging to the L-SGA and W-SGA groups at birth. Based on the weight and nutritional status of the L-SGA group, we separated them into a proportionally retarded group A and further into subgroups B, C and D. Similarly, the W-SGA group was divided into group A and subgroups E, F and G based on their length and nutritional status. Furthermore, we calculated the average height at 18 for each of the 64 cells of the birth MDN matrix.
Of the 6,335 18-year-old males investigated, based on their bodily development and nutritional status as birth 1,274 of them were placed in the major groups (sectors) on the MDN matrix. [Table-1] gives their distribution.
Of the 18-year-old men investigated, 213 were found to be proportionally retarded (PR) at birth. Of these, 103 (48.4%) were placed in the AA sector at age 18, 14.1% were in the moderately overnourished (MON) sector, 2.3% were extremely overnourished (EON), 5.6% moderately undernourished (MUN), 1.9% proportionally overdeveloped (POD), while only 27.7% remained of low weight and low height, in the proportionally reatrded sector. Naturally, 27.7% is not a small percentage, but it is considerably smaller than 100%.
These correlations make it clear that knowing the birth length and weight is not enough in itself to be able to predict with certainty which of the children born at a disadvantage in length and weight will need to participate later in growth hormone therapy. Obviously for this it is necessary to clarify the other factors that can influece growth in childhood, but we are not yet at this stage. However, it is important that we identify neonates and infants who have a significant chance of growth regardation as soon as possible so that they can be put under regular monitoring in case they turn out to need growth hormone treatment.
We further investigated whether knowing a neonate’s position on the MDN matrix will assist us in identifying newborn children who have an above-average probability of requiring hormone therapy in the future.
From [Fig-3] we can see that the average height of the absolutely average (AA) group is 176.1cm, while the average height of the proportionally retarded (PR) group is 5.3cm shorter, only 170.8cm. The t-test shows that this difference is highly significant (***, t value 13.91). As for the other sub-groups within in the SGA group, along the left-hand side and bottom of the matrix and below the 10th percentile, subgroups B nd E, directly next to the PR (A) group, the difference is also highly significant, but with t values of 6.43 and 7.90, respectively. The figure shows clearly (i) how heterogeneous the length and nutritional status is of the group labeled SGA is when we look at the weight development and (ii) the farther from the proportionally retarded A group we proceed, the higher the average height values become, within both the L-SGA and W-SGA groups.
In order to gain a more precise picture of which neonates can be considered potential candidates for growth hormone therapy, we calculated the average height at 18 for each of the 6,335 conscripts belonging to the W-SGA and L-SGA groups.
Compared to the AA group, highly significant (***) values are found just for the cells framed in red. Within these groups we can find four cells for the proportionally retarded, with lowest average heights.
Based on these results, we can state that children who placed at birth within the cells outlined in bold grey line are those that should be given long-term and strict monitoring. There are 1,394 of them, which makes up 22% of the 6,335 investigated. It is necessary to be aware that of the 449 proportionally retarded newborns, only 123 (27.7%) of them remain in the PR group based on values measured at age 18. The others move to other groups: 48% to the AA group, 14.1% to the MON group, etc. The reason for this is most certainly that other growth factors are able to compensate for a disadvantaeous start in life [12,13] , such as positive genetic and ethnic factors or nutritional, metabolic and neuroendocrinal conditions. However, the same thing can occur in reverse. It is possible that a child born with average development and nutritional status, or born overdeveloped, can end up in the PR group at 18 due to the negative influences of various factors.
The determination of height carried out for each cell within the L-SGA and W-SGA groups makes it possible for us to take a stand on this question. Based on their further growth, can we say that there is any reason to treat those placed at birth under the 3rd percentile any differently from those in the 3rd-10th percentile?
[Fig-4] shows that there does not appear to be. Of the L-SGA group, those below the 3rd profile have, in all cases, somewhat lower height at 18 than those in the 3rd-10th percentile, but this difference was not found to be significant. No particular difference at all can be found between the two categories for W-SGA. Considering these findings, we recommend that newborns to be placed under strict monitoring be those below the 10th percentile in height and/or weight and not those below the 3rd percentile.
The neonates most likely to need growth hormone therapy are the proportionally retarded, whose deviation from the AA sector average height is the largest and who (being located in the lower left of the MDN matrix) belong to the SGA group in both birth weight and length. Although it is true that “only” 27.7% of those placed in the proportionally retarded group at birth remained in the lower left corner of the MDN matrix based on their data at age 18, it is also true that, for those in the PR group at 18 - the young men who are lowest in both height and weight and thus classified as proportionally retarded - 48.0% were also in the PR group at birth.
However, we would also like to point out that it is not enough to strictly monitor the later physical growth only of proportionally retarded (PR) neonates born under the 10th percentile, since a significant degree of growth retardation compared to the abolutely average (AA) group is also found in height at age 18 for those neonates in the four cells bordering the PR group in both the L-SGA and the W-SGA groups. Therefore, the probability is high that the height of such neonates will remain under the average height, though to a lesser degree than neonates in the PR group.
Based on our results, we have confirmed that the MDN system is highly suitable for classifying neonates by their bodily development and nutritional status. It is suitable for comparing the morbidity and mortality rates of neonates with varied values for bodily development and for nutritional status. From this study, we can also state that the position of a neonate on the MDN matrix allows us to identify with high probability those children who will require regular monitoring, as we can associate it with potential retardation in height. These children are potential candidates for growth hormone therapy.
We feel it necessary to stress that the MDN system cannot assist in the decision of whether growth hormone therapy should be recommended in any particular case, but only in identifying neonates and children who should be put under strict observation by a pediatric endocrinologist, bearing in mind that among them there will be children who will not need growth hormone therapy.
[1] Berkő P. (1992) A study of the incidence, causes and consequences of retardation with the UFT system Thesis, Miskolc.
» CrossRef » Google Scholar » PubMed » DOAJ » CAS » Scopus
[2] Joubert K. (2000) J. Hungarian Gynecol., 63,155-163.
» CrossRef » Google Scholar » PubMed » DOAJ » CAS » Scopus
[3] Berkő P. and Joubert K. (2006) Orvosi. Hetilap., 147(29), 1369-1375.
» CrossRef » Google Scholar » PubMed » DOAJ » CAS » Scopus
[4] Berko P. and Joubert K. (2009) Journal of Maternal-Fetal and Neonatal Medicine, 22(7), 552-559.
» CrossRef » Google Scholar » PubMed » DOAJ » CAS » Scopus
[5] Berkő P. and Joubert K. (2012) Perinatal Mortality, InTech, Zagreb, 11-27.
» CrossRef » Google Scholar » PubMed » DOAJ » CAS » Scopus
[6] Abbasi V. (1998) Pediatrics, 102(3), 507-511.
» CrossRef » Google Scholar » PubMed » DOAJ » CAS » Scopus
[7] Lee K.W. and Cohen P. (2004) Hormone Research in Paediatrics, 56(1), 29-34.
» CrossRef » Google Scholar » PubMed » DOAJ » CAS » Scopus
[8] Styne D.M. (2004) Hormone Research in Paediatrics, 60(1), 22-26.
» CrossRef » Google Scholar » PubMed » DOAJ » CAS » Scopus
[9] Patel L. and Clayton P.E. (2006) Clinical Pediatric Endocrinology, Hong Kong, 90-112.
» CrossRef » Google Scholar » PubMed » DOAJ » CAS » Scopus
[10] Joubert K. and Gyenis G.Y. (2001) Research Reports of the Population Research Institute of the Hungarian Central Statistical Office, Rep. No. 70.
» CrossRef » Google Scholar » PubMed » DOAJ » CAS » Scopus
[11] Joubert K. and Gyenis G. (2003) HOMO-Journal of Comparative Human Biology, 54(2), 104-112.
» CrossRef » Google Scholar » PubMed » DOAJ » CAS » Scopus
[12] Péter F. and Muzsnai Á. (2010) Gyermek-Endokrinológia, Semmelweis Kiadó, Budapest, 101-131.
» CrossRef » Google Scholar » PubMed » DOAJ » CAS » Scopus
[13] Ságodi L. (2011) Gyermekorvos Továbbképzés, 10(2), 15-19.
» CrossRef » Google Scholar » PubMed » DOAJ » CAS » Scopus
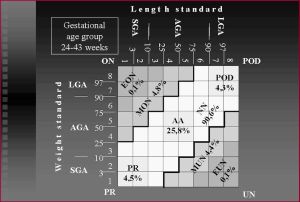 | Fig. 1- Major neonatal groups based on bodily development and nutrition and their distribution within the Hungarian neonate population. |
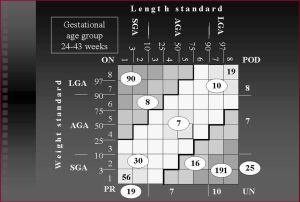 | Fig. 2- Perinatal mortality rates (‰) in the major groups of the Hungarian neonate population (gestational age 24-43 weeks) born between 1997 and 2003. |
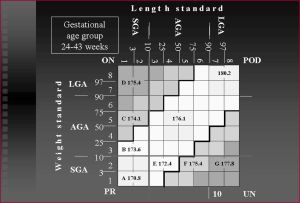 | Fig. 3- Average height at 18 of those born into the sub-groups of the SGA by length (LSGA) and by weight (WSGA) |
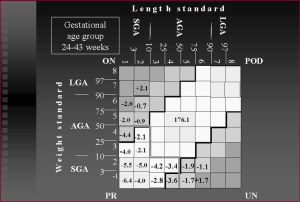 | Fig. 4- Deviations within the L-SGA and W-SGA groups from the height of those born as absolutely averagely developed (AA) |
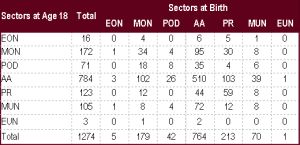 | Table 1- Distribution of examined 18-year-olds in the major sectors at age 18 and at birth. |