ISSN : 0975-2927
EISSN : 0975-9166

RAJKUMAR K.K.1*, RAJU G.2
1School of Information Science & Technology, Kannur University, Kannur, Kerala, India
2School of Information Science & Technology, Kannur University, Kannur, Kerala, India
* Corresponding Author : rajatholy@yahoo.com
Received : 06-11-2011 Accepted : 09-12-2011 Published : 12-12-2011
Volume : 3 Issue : 4 Pages : 310 - 317
Int J Mach Intell 3.4 (2011):310-317
DOI : http://dx.doi.org/10.9735/0975-2927.3.4.310-317
Conflict of Interest : None declared
Wavelet transformation is one of the most effective mathematical tools for analyzing mammogram images which posses’ fuzzy likes texture characteristics. In this paper we carried out a comparative study of performance of discrete wavelet transformation (DWT) and stationary wavelet transformation (SWT) for classifying mammogram images into Normal, Benign and Malignant. In each wavelet transformations, a fractional part of the highest wavelet coefficients is used as features for classification. Initially we created a class core vector for each risk level using ten percent of images from each set. This acts as the basis of the classification. Then each test image in the dataset is classified into the appropriate risk level by the Euclidean distance between the features of the test image and the class core vectors. Using discrete wavelet transformation, 83 % of the images were correctly classified into exact risk level. On the other hand using stationary wavelet transformation obtained only 76% of accuracy. We also made a comparative analysis of other distance measure called Bray Curtis. But the result obtained in Bray Curtis is not much promising. The study also reveals that the redundant nature of coefficients in stationary wavelet transformation is not suitable for identifying tumors in mammograms.
Benign, Breast cancer, Bray Curtis distance, Discrete Wavelet transform (DWT), Euclidean distance, Malignant, Mammogram texture, Stationary Wavelet Transform (SWT).
Breast cancer is the most common type of cancer among the women and it is the second leading cause of deaths for women especially in developed and under developed countries. In India, breast cancer accounts for 23% of all female caners followed by cervical cancer which is 17.5%. Nowadays it is found that breast cancer is not limited to women, but 1% of men also get affected by this disease. [1,2,3] . There is no specific treatment suggested by the medical experts so far for curing this disease but only available provision is the early detection. Unfortunately, the signs are very subtle and vary in appearance at the early stage of breast cancer. However, it is difficult for radiologist to provide both accurate and uniform evaluation for the enormous number of mammogram generated in widespread screening. Human observations have limitation. For example, some anomalies may be missed due to human error as a result of fatigue [4,5] . The most accurate detection method in the medical environment is the biopsy. But it has some discomfort for the patient and its cost is high. Biopsy also involves high percentage of negative cases. Therefore computer aided detection will provide as a second opinion for the detection of the tumor. As a first step of this, X-ray mammography is considered as a standard procedure for breast screening and diagnosis. But the performance of this X-ray mammography for the breast cancer screening is also not up to the mark, the accuracy is only about 75% [6] . Screen film mammography is the best suitable method accepted today for the diagnosis. It reduces the negative biopsy ratio and the cost to society by improving feature analysis and refining criteria for recommending biopsy.
Digital mammography is a convenient and easy tool in classifying tumors and many applications in the literature prove its effective use in breast cancer diagnosis [7,10] . Clustered micro calcifications (MCS) are one of the mammographic hallmarks of the breast tumor. However not all MCS are the indication of malignancy, since they can occur during the course of other benign disease too. The first major task of the mammogram analysis is the classification of images with cancerous lesion and then to detect the risk level of the tumor cells in the mammogram images classified, i.e. benign or malignant [8,9] .
Texture information plays an important role in image analysis and detection in medical diagnosis. Texture is one of the important characteristics used in identifying an object or region of interest (ROI) in an image. Since medical images are low contrast, complex anatomical structure and variability associated with their appearance, it is usually very difficult to distinguish between benign and malignant micro calcification clusters. An image region may be called cancerous (positive) or normal (negative) and a decision for detection result therefore will be one of four possible categories: true positive (TP), true negative (TN), false positive (FP) and false negative (FN). FN and FP represents two kinds of errors. An FN error implies that true abnormality was not detected and a FP error occurs when a normal region was falsely identified as abnormal. A TP decision is correct judgment of an existing abnormality and a TN decision means that a normal region was correctly labeled [11,6] .
In this paper, we make a comparative study of classifying mammogram images using stationary wavelets [6] and discrete wavelet transformations [12] . The methods suggested by these two papers are exact simulation of supervised classifier for classifying tumors into its risk level. For the classification, we formulated a class core vector for each class of mammogram images. For the computation of class core vector ten percent of ROIs of the mammogram images of normal, benign and malignant classes are considered from the Mini-Micas database [13] . The rest of the paper is organized as follows. In the next section, we discuss about the Mini-Mias Database. The discrete wavelet transformations (DWT) and the stationary wavelet transformations (SWT) are discussed following section. Next we explained the method for the classification of mammogram images using the two different wavelet transformations. The results of the both methods and its comparisons are discussed followed by this. Finally the conclusion is given in the last section.
The Mammography Image Analysis Society (MIAS) is an organization in UK. It is a research group interested in the study of mammogram images. They have produced a digital mammography database for research purpose. The X-ray films in the database have been carefully selected from the United Kingdom National Breast Screening Program and digitized with a Joyce Lobel scanning microdensitometer to a resolution of 50μm x 50μm with 8 bits storage. The mammogram images that they created are investigated and labeled by expert radiologists. The original mammograms are 1024 x 1024 pixels. From the selected images regions of interest (ROIs) are extracted with size of 128 x 128 pixels. These ROIs are abnormality centered [1,12] .
Wavelet Transformation (WT) is a mathematical tool for analyzing signals and images in time frequency domain. It decomposes signals or images into different functions called wavelet family in which all of the basic functions are derived from scaling and translation of single function called the mother wavelet. By representing signals or images in time frequency domain has two main advantages: (a) an optimal resolution both in the time and frequency domains; and (b) the lack of stationary nature of the signal. It is defined as the convolution between the signal X (t) and the wavelet functions ψa, b (t) and it is represented as:
Wψ X(a,b) =
Where ψa,b)(t) are dilated or contracted and shifted versions of a unique wavelet function ψ (t)
Ψ(a,b)=|a|-½ ψ (2)
(a, b are the scale and translation parameters, respectively). The WT gives a decomposition of X (t) in different scales, tending to be maximum at those scales and time locations where the wavelet best resembles X (t). Moreover, Eq. (1) can be inverted, thus giving the reconstruction of X (t). The WT maps a signal of one independent variable t onto a function of two independent variables a, b. This procedure is redundant and not efficient for algorithmic implementations. In consequence, it is more practical to define the WT only at discrete scales a and discrete times b by choosing the set of parameters {aj = 2 –j; bj, k = 2-j k}, with integers j, k.
Contracted versions of the wavelet function match the high frequency components of the original signal and on the other hand, the dilated versions match the low frequency components. Then, by correlating the original signal with wavelet functions of different sizes we can obtain its details at different scales. These correlations with the different wavelet functions can be arranged in a hierarchical scheme called multi resolution decomposition. The multi resolution decomposition separates the signal into ‘details’ at different scales, the remaining part being a coarser representation of the signal called ‘approximation’. The decomposed signal or image contains details and approximation. The lower levels give the details corresponding to the high frequency components and the higher levels corresponding to the low frequencies.
The discrete stationary wavelet transform (SWT) is an effective numerical solution for signal and image processing applications. Discrete stationary wavelet transformations are also called as undecimated wavelet transforms or the invariant wavelet transforms due to the redundant nature of the wavelet coefficients after the decomposition. In this transformation, there is no down sampling of the frequency components so it gives better approximation details. Since this property of the discrete stationary wavelet transform, it is very much useful for analyzing a linear system. The computation of stationary wavelet coefficients are depicted in below [Fig-1] . The original signal X [n] are decomposed into H0 and G0, which are called as the detail and approximation coefficients of SWT. The filters Hj and Gj are the standard low pass and high pass wavelet filters. These filters are obtained by up sampling the filters of previous step Hj-1 and Gj-1 [14] . The detail coefficients d1 [n] are the output of high pass filters and a3 [n] are the output of low pass filters. According to the time frequency properties of the wavelet transform Hj and Gj are bank of ideal narrow band filters. [15,16] .
Discrete wavelet transformation or decimated wavelet transformation is the most useful technique for frequency analysis of signals that are localized in time space. The discrete wavelet transform corresponds to multiresolution approximation expression. This method permits the analysis of the signal in many frequency bands or at many
scales. In practice, mutiresolution analysis is carried out using 2 channel filter banks composed of a low-pass (G) and a high-pass (H) filter and each filter bank is then sampled at a half rate (1/2 down sampling) of the previous
frequency. By repeating this procedure, it is possible to obtain wavelet transform of any order. The down sampling procedure keeps the scaling parameter constant (n=1/2) throughout successive wavelet transforms so that it benefits for simple computer implementation. In the case of an image, the filtering is implemented in a separable way by filtering the rows and columns.
The above two transformation discussed are tree level decomposition and hence it is called discrete wavelet transformation. The discrete wavelet transformation is a useful technique for frequency analysis of signals that are localized in time space. The discrete wavelet transformation also corresponds to multiresolution approximation. This method permits the analysis of the signal in many frequency bands or at many scales. In practice, mutiresolution analysis is carried out using 2 channel filter banks composed of a low-pass (G) and a high-pass (H) filter and each filter bank is then sampled at a half rate (1/2 down sampling) of the previous frequency. By repeating this procedure, it is possible to obtain wavelet transform of any order. The down sampling procedure keeps the scaling parameter constant (n=1/2) throughout successive wavelet transforms so that it benefits for simple computer implementation with minimum time and good accuracy. In the case of an image, the filtering is implemented in a separable way by filtering the rows and columns.
The discrete wavelet transform also very useful for texture analysis in the image. Its fast implementation is usually performed by using multiresolution analysis. The wavelet coefficients are sampled based on the Nyquist criteria. The transformation coefficients are non-redundant and the total number of sample in the transformation is equal to the total number of the image pixels. It also reduces the computation time because of the down sampling of the coefficients. By comparing the stationary wavelet transform, discrete wavelet transformation produces better detection rate in better time for signals and images which posses varying texture features. But the Stationary wavelet transform produces very promising results for analyzing signal and images which has linear texture nature and invariance by translation. The cost of computation is also high in Stationary wavelet transformation.
Image texture is a confusing measurement that depends mainly on the scale in which the data are observed. Different types of images have different types of texture. Textures of mammograms are irregular and it posses fuzzy like characteristics. Wavelet transformation is the best tool for analyzing images of these characteristics. In this paper we propose a modified version of the work suggested by Rocha by Ferrerira, Leandro Borges and E.A Rasheed et al in their paper [17,7] for classifying mammogram images using wavelet multiresolution analysis.
Classification of mammogram images are done by taking fractional part of the highest wavelet decomposition coefficients as the features. We use wavelet decomposition in four different levels and class core vectors are also calculated on each level of the wavelet decomposition. Two different types of wavelets called discrete stationary wavelet transformations (SWT) and discrete wavelet transformations (DWT) are used for creating the class core vector [6,12] . The classification is carried out with different wavelet families- Daubechies, Haar and Biorthogonal.
For classification purpose, we extracted a set of 322 ROIs from the original mammogram image from the Mini-Mias database by manually identifying the center location of the abnormality of the mammogram images and then extracted a size of 124 x 124 around the origin of abnormality. Thus we extracted ROIs for both benign and malignant classes of the specified size. But for normal mammogram images, ROIs are extracted of size 124 x 124 around the centre of the each mammogram images.
The proposed method consist two parts viz training and testing. In the training part, we created class core vectors for each class of the mammogram images. The classes are normal, benign and malignant. The class core vectors are computed by taking 10 percent of the ROIs are randomly selected from each class of the image instead of 25 percent of images in the entire dataset of the original work proposed in [17] . The class core vectors are created on all four levels of wavelet decomposition using the following equation:
(3)
Where the mth class core vector at j level decomposition, N is the number of ROI’s selected to produce the class core vector and
is the fraction of biggest wavelet coefficients of the ROI’s selected from the mammogram image for the class m at decomposition level j.
In the testing part, individual ROIs image in the dataset is classified by designing a new classification algorithm, which is based on calculating the distance between the feature vector and the class core vector on all four different levels of the wavelet decomposition. Then this new system automatically classifies the test image in the dataset by finding the minimum Euclidean distance between feature vectors of the test image to the each of the class core vector by using Euclidean distance formulae
Dist(A, ) =
(4)
Where Am is the coefficient vector of the jth decomposition level for the test image, is the class core vector for class m at decomposition level j and m is the number of classification classes. Here m is 3 (Normal, Benign and Malignant). Finally we also made a new distance measure named Bray Curtis for making a comparative study of distance measure with Euclidean distance using the formulae.
Dist(A, ) =
(5)
We implemented the algorithm discussed above in matlab 7.0 and tested the performance of the algorithm using three different sets of images namely normal, benign and malignant images found in the Mini-Mias dataset. The classification of the images is done using two different wavelet transformations called discrete wavelet transformation and stationary wavelet transformation. We created a class core vector for each class using ten percent of images selected randomly from all the three categories in the dataset. Testing purpose we have chosen 162 mammogram ROIs randomly from the dataset which comprises of 98 normal images, 38 benign and 26 malignant images.
The proposed algorithm uses only a fractional part of the wavelet coefficients to describe the characteristics of a mammogram images. The wavelet coefficients are generated using three wavelets filters. The filters used are the Daubechies-4, Daubechies-8 and Daubechies-16 from Daubechies, Haar wavelet from Haar family and bior 2.8 from Biorthogonal family. The Euclidean distance and Bray Curtis distance are measured between the class core vector and the feature vector of the test images are calculated by taking the average distance between the class core vector and the feature vector of the test image in all four different levels of the wavelet decomposition. The tested image is then labeled to the respective class where the distance measures between feature vectors to that class core vector is minimum.
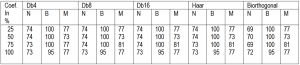
The classification results using discrete wavelet transformation of each 162 mammogram ROIs in two different distance measures are shown in [Table-1] and [Table-2] . Out of 98 normal ROIs 76% of ROIs are correctly classified using the 50% of the biggest wavelet coefficients in both Daubechies and Haar wavelet family decomposition in Euclidean distance measure whereas it is only 74% in Bray Curtis measure. Out of 38 benign ROIs, 100% classification is achieved in almost all wavelet filters using Bray Curtis measure. But Euclidean measure, 100% classification has possible only in Db4, Db8, Db16 and Haar using 50% of the biggest wavelet coefficients. The same percent of result is obtained in Db8 and Db16 of Daubechies family using only 25 % of wavelet coefficients. In 26 malignant images, 88% of ROIs are correctly classified using 75% of wavelet coefficient for all the three wavelet families in Euclidean distance measure which never achieved in Bray Curtis measure. By using discrete wavelet transformation we achieved 88% of classification rate in Euclidean measure using db8 filters in Daubechies family, where as 85% of classification rate is only possible in Bray Curtis measure with same wavelet filters.
The classification results of 162 mammogram ROIs using stationary wavelet transformation in two different distance measures are shown in [Table-3] and [Table-4] . Out of 98 normal mammogram ROIs, 80% of ROIs are correctly classified using Biorthogonal and Daubechies wavelet family using Euclidean distance measure whereas it is 79% in Bray Curtis measure. Out of 38 benign images, 79% of ROIs are correctly identified and classified using 25 percent of biggest coefficients in Biorthogonal wavelets and it is only 76% in the other measure. Finally, 65% of malignant ROIs are correctly classified out of 26 images using 100 percent of biggest coefficients in Daubechies-16 family and the same percentage of detection rate is achieved only in Haar wavelet filters. The overall detection rate of this classification algorithm is 76 % in Euclidean distance measure and 72% in Bray Curtis measure.
By comparing the data shown in Tables and the graphs next pages, the classification rate of benign and malignant images using discrete wavelet transformation are very high with respect to stationary wavelet transformation. In the case of normal mammogram images, the classification rate is very promising using stationary wavelet transformation instead of discrete wavelet transformation. This reveals that the redundant nature of wavelet coefficients in stationary wavelet transformation is not suitable for analyzing fuzzy like texture characteristics of benign and malignant mammograms. The classification rate of normal mammograms are very high in stationary wavelet transformation because of the linear intensity and frequency distribution of mammogram image texture, which is almost true for all part of the normal mammogram images. The classification rate measured using Euclidean distance method is far better than Bray Curtis method. It is also noticed that the classification rate of benign mammogram images using Haar wavelet is very poor compared all other wavelet filters used in this paper. Finally the discrete wavelet transformation is better for analyzing the mammogram images which have abnormality or tumor cells.
The primary intention of this work is the comparison of the classification of mammogram images using discrete wavelet transformation and stationary wavelet transformation with different distance measures. In this paper, we used only fractional part of the biggest wavelet coefficients as the class core vectors and feature vectors in all the multilevel wavelet decomposition of mammogram images. The results shown in the tables and graphs indicate that redundant nature of coefficients in stationary wavelet transformation is not suitable for identifying tumors in mammograms. But it produced high classification rate for normal mammogram images which has linear intensity distribution all over the ROIs considered for the classification. By using discrete wavelet transformation, we could classify all the benign images in the test set correctly. DWT also produced better classification results in the case of malignant images. The classification rate of normal mammogram images are not much promising compared to stationary wavelet transformation. The Euclidean distance measure is the effective distance measure compared to Bray Curtis distance measure for the proper classification of the mammogram images with tumors. Hence, finally we conclude that undecimated wavelet transformation is not an effective mathematical tool for classification and analyzing tumor cells which posses fuzzy like characteristics in the mammograms.
[1] Thangavel K., Karnan M., Sivakumar R., Kaja Mohideen A. (2005) ICGST-GVIP Journal, Vol. 5, Issue 5.
» CrossRef » Google Scholar » PubMed » DOAJ » CAS » Scopus
[2] Sakka E., Prentza A., Koutsouris D. (2005) Oncology Reports 15: 1049-1055.
» CrossRef » Google Scholar » PubMed » DOAJ » CAS » Scopus
[3] Cheng H.D. and Jingli Wang (2003) ICASSP 2003 – ISBN No. 0-7803-7663-3/03 2003 IEEE.
» CrossRef » Google Scholar » PubMed » DOAJ » CAS » Scopus
[4] Moayedi F., Azimifar Z., Bootsani R., Katebi S. (2007) ICIAR 2007, Lecture Notes in Computer Science 4633, pp. 923-934.
» CrossRef » Google Scholar » PubMed » DOAJ » CAS » Scopus
[5] Hassanien A. (2007) Image and Vision Computing 25, pp. 172-183.
» CrossRef » Google Scholar » PubMed » DOAJ » CAS » Scopus
[6] Rajkumar K.K. (2011) NCC2011.
» CrossRef » Google Scholar » PubMed » DOAJ » CAS » Scopus
[7] Essam A. Raheed, Ismail A. Ismail, Sherif I. Zaki (2007) Pattern Recognition Letters 28, 286-292.
» CrossRef » Google Scholar » PubMed » DOAJ » CAS » Scopus
[8] Essam A. Rasheed, Mohammed G. Awad (2006) CSCBC First Canadian Student Conference on Biomedical Computing.
» CrossRef » Google Scholar » PubMed » DOAJ » CAS » Scopus
[9] Rajkumar K.K., Raju G. (2010) International conference on Mathematics and Computer Science, ICMCS 2010, February 2010, ISBN 978-81-908234-2-5.
» CrossRef » Google Scholar » PubMed » DOAJ » CAS » Scopus
[10] Jong Kool Kim, Hyun Wook Park (1999) IEEE Transactions on Medical Imaging, Vol 18, No.3.
» CrossRef » Google Scholar » PubMed » DOAJ » CAS » Scopus
[11] Sakka E., Prenta A., Koutsouris D. (2006) Oncology Reports 15: 1049-1055.
» CrossRef » Google Scholar » PubMed » DOAJ » CAS » Scopus
[12] Rajkumar K.K., Raju G. (2011) First International Conference on Advances in Computing and Communication (ACC 2011) @ 2011 ACC Organize, published by Springer, pp. 2046-2055.
» CrossRef » Google Scholar » PubMed » DOAJ » CAS » Scopus
[13] http://www.wiau.man.ac.uk/services/MIAS/MIAS/mini.html: The Mammographic Image Analysis Society: Mini Mammography Database, (2008).
» CrossRef » Google Scholar » PubMed » DOAJ » CAS » Scopus
[14] Nason G.P., Silverman B.W. (1995) Tech. Rep. BS8 1Tw, University of Bristol.
» CrossRef » Google Scholar » PubMed » DOAJ » CAS » Scopus
[15] Beylkin G. (1992) SIAM Journal Numerical analysis, 29, 1716 - 1740.
» CrossRef » Google Scholar » PubMed » DOAJ » CAS » Scopus
[16] Shensa M.J. (2002) IEEE Trans. on Information Theory, 40, 2464 - 2482.
» CrossRef » Google Scholar » PubMed » DOAJ » CAS » Scopus
[17] Cristiane Bastos Rocha Ferreira, Dibio Leandro Borges (2003) Pattern Recognition Letters, 24, 973-982.
» CrossRef » Google Scholar » PubMed » DOAJ » CAS » Scopus
 | Fig. 1- The Stationary Wavelet Transform |
 | Fig. 2- The Discrete Wavelet Transform |
 | Fig. 3- Db4 |
 | Fig. 4- Db8 |
 | Fig. 5- Db16 |
 | Fig. 6- Haar |
 | Fig. 7- Biorthogonal |
 | Table 1- Successful classification rate (in %) of mammogram images using discrete wavelet decomposition (Euclidean) N: Normal B: Benign M: Malignant |
 | Table 2- Successful classification rate (in %) of mammogram images using discrete wavelet decomposition (Bray Curtis) N: Normal B: Benign M: Malignant |
 | Table 3- Successful classification rate (in %) of mammogram images using discrete stationary wavelet decomposition (Euclidean) N: Normal B: Benign M: Malignant |
 | Table 4- Successful classification rate (in %) of mammogram images using discrete stationary wavelet decomposition (Bray Curtis) N: Normal B: Benign M: Malignant |