ISSN : 0975-2927
EISSN : 0975-9166

ALIREZA AZARI MOGHADDAM1*, LALITHA RANGARAJAN2
1Department of Studies in Computer Science, University of Mysore, Mysore, India
2Department of Studies in Computer Science, University of Mysore, Mysore, India
* Corresponding Author : arazarim@gmail.com
Received : 06-11-2011 Accepted : 09-12-2011 Published : 12-12-2011
Volume : 3 Issue : 4 Pages : 307 - 309
Int J Mach Intell 3.4 (2011):307-309
DOI : http://dx.doi.org/10.9735/0975-2927.3.4.307-309
Conflict of Interest : None declared
Defects detection is very important to guarantee the welding quality. Many researchers have been done on this area. However, most of them are limited in efficiency. Different from these researches, a method that is used to detect defects from the radiographic images of welding is put forward. This paper discusses an effective method to segment of the defects in welding images. We also use Two Dimensional Left Median Filter for enhancing the images. Experimental results show this method is effective in noisy and low contrasted radiographic images of weld.
Defect detection, Radiographic Image, Weld.
Welding is process of joining which is used in larger applications of mechanical engineering [1] . The inspection of welds is a very important task for assuring safety and reliability in industries. Non-Destructive Testing (NDT) techniques have been employed to test a material for surface or internal flaws without interfering in any way with its suitability for service. Radiography seems to be the most effective method and the experts are able to identify most types of defects in the images produced by this method. The method is based on the fact that the defective areas absorb more energy and thus the defects appear darker in the image (Hayes, 1997) [2] .
The radiographic images are contaminated with noise and are also blurred. In order to improve the image for observation and accurate analysis, various digital image processing techniques can be applied. Noise removal is required for improving the quality of the image in order to better recognize the defects. Different noise removal filters are used [3] . In digital image processing, filtering is the most common and basic operation, because the results of filtering directly influence all the following operations such as edge detection, image enhancement, etc [4] .
Weld radiographs are checked and interpreted by human experts. However, interpretation of weld radiographs by humans is very subjective, inconsistent, labor-intensive and sometimes biased. Therefore, various automated inspection techniques for weld radiographs were attempted worldwide over the past years. Computer vision is a key factor for the implementation of total quality within the different processes in industrial automation [5] .
With respect to detection of defects, in most of the papers, thresholding, Otsu method and neural network were carried out [6-14] . In some of the papers different methods were experimented, such as, Linear Correlation Coefficient, Time of flight Diffraction (TOFD), and Fuzzy SVM & Beamlet transform [15-17] .
Research in this area continues largely because no satisfactory results that allow the detection of the totality of defects without false alarms were achieved. Additionally, it is not possible to determine which lines of investigation will improve the overall result, because each of them has room for improvement.
In this article we will focus on welding defects using segmentation techniques applied to the radiographic images. Segmentation is one of the most difficult tasks in image processing, particularly in the case of noisy or low contrast images such as radiographic images of welds. We enhance radiographic images by Two Dimensional Left Median Filter (2D-LMF) and propose a method for detection weld defects.
2D-LMF is described in section 2, the proposed algorithm is shown in section 3, experimental results exhibited in section 4. Section 5 concludes the paper.
In the 2D-LMF, a square window of size pXp (p is an odd number) is considered. The centre pixel in the scan window is to be de-noised. The value of the central pixel in the scan window is replaced by the mean of q (= (p+1)/2) pixels of the scan window. The first step is to sort the value of all pixels in the scan window (x1, . . . , xmed-1, xmed, xmed+1, . . . , xp X p) , next step is to calculate the 2D-LMF in the scan window (1), and finally to change the value of the central pixel in the scan window into the 2D-LMF sequence.
med
2DLMFi, j = ( Σ xk ) / q (1)
(med-q+1)
From the observation of the horizontal line profiles of weld images without defects, we found one common feature of almost all the line profiles: each profile has a bell shape like a Gaussian curve, as shown in [Fig-1] . If there are any defects in a profile, the curve shape has changed, as shown in [Fig-2] .
In this research, we suggest an algorithm to check images line by line for find the defects. We have separated the bell shape to two sections, increasing gray values (IG) and decreasing gray values (DG) sections. As a first step, we found Region of Interest by using mean and variance of elements of each line; we check the image line by line. In IG section, any decreasing gray value is an anomaly, and in DG section, any increasing gray value is an anomaly.
Then we detect these anomalies in second step. Approved size of defects based on American Petroleum Institute Standard (API 1104) has been defined, thus; Maximum diameter of Porosity shall not exceed 2.4 mm and also the width of an Elongated Slag Inclusion indication exceed 1.6 mm, and bigger sizes will be considered as a defect.
There are 2.8 X 2.8 pixels in each square millimeter of our radiographic images, then; we tested window sizes 3X3 and 2X4 for finding defects. We found window size 2X4 as the optimal size for detection of defect.
We tested the proposed approach with gray-scale radiographic images; with gray values in [0 to 255]. We tested in algorithm 32 radiographic images, with included that 73284 horizontal lines; in the selected images 20% have no defects and 80% are defective. In preprocessing stage, we used two dimensional left median filters (2D-LMF). We also consider a square window of size 9X9 for filtering.
With our method, 90% of images with defects have been segmented correctly, but for images without defects, the error rate is 27%.
The experimental results showed that the proposed method was effective and feasible to segment and locate defects in noisy and low contrasted radiographic images of weld.
In this paper, we have proposed a segmentation method for detection of weld defects in radiographic images. We used two dimensional left median filter for de-noising the radiographic images. Experimental results show that, our defects detection methodology has a high successful detection in radiographic images with defects. Generally, the method of detection of defects in welding lines is effective. The proposed method can reduce the working effort of human being and increase the defect detection efficiency. We have to improve our methodology for radiographic images without defects in future studies.
[1] Rathod V.R. and Anand R. (2010) IEEE, 2, 673-677.
» CrossRef » Google Scholar » PubMed » DOAJ » CAS » Scopus
[2] Valavanis I. and Kosmopoulos D. (2010), Expert Systems with Applications, 37, 7606-7614.
» CrossRef » Google Scholar » PubMed » DOAJ » CAS » Scopus
[3] Rale A., et al., (2009) International Conference of Emerging Trends in Electronic and Photonic Devices & Systems (ELECTRO), 193-197.
» CrossRef » Google Scholar » PubMed » DOAJ » CAS » Scopus
[4] Aboshosha A., et al., (2009) IEEE, 245-250.
» CrossRef » Google Scholar » PubMed » DOAJ » CAS » Scopus
[5] Goumeidane A., et al., (2009), 309-319.
» CrossRef » Google Scholar » PubMed » DOAJ » CAS » Scopus
[6] Li D. and Liao T.W. (1996), 222-226.
» CrossRef » Google Scholar » PubMed » DOAJ » CAS » Scopus
[7] Wang G. and Liao T.W., (2002) NDT & E International, 35, 519-528.
» CrossRef » Google Scholar » PubMed » DOAJ » CAS » Scopus
[8] Carrasco M. and Mery D. (2004) Materials Evaluation, 62, 1142-1147.
» CrossRef » Google Scholar » PubMed » DOAJ » CAS » Scopus
[9] Nacereddine N., et al., (2005) World Academy of Science, Engineering and Technology, PWASET, 2, 145-148.
» CrossRef » Google Scholar » PubMed » DOAJ » CAS » Scopus
[10] Weixin G., et al., (2007) 79-83.
» CrossRef » Google Scholar » PubMed » DOAJ » CAS » Scopus
[11] Amin E. (2008) Journal of Nuclear and Radiation Physics, 3, 83-92.
» CrossRef » Google Scholar » PubMed » DOAJ » CAS » Scopus
[12] Mahmoudi A. and Regragui F. (2009) 857-860.
» CrossRef » Google Scholar » PubMed » DOAJ » CAS » Scopus
[13] Mahmoudi A. and Regragui F. (2009) World Congress on Computer Science and Information Engineering, IEEE, 111-115.
» CrossRef » Google Scholar » PubMed » DOAJ » CAS » Scopus
[14] Zapata J., et al., (2010) NDT & E International, 43, 191-199.
» CrossRef » Google Scholar » PubMed » DOAJ » CAS » Scopus
[15] Da Silva R.R., et al., (2002) Journal of Nondestructive Testing, 7, 1-8.
» CrossRef » Google Scholar » PubMed » DOAJ » CAS » Scopus
[16] De Moura E., et al., (2003) presented at the 3th Pan-American Conference for Nondestructive Testing, Rio.
» CrossRef » Google Scholar » PubMed » DOAJ » CAS » Scopus
[17] Sun Z., et al., (2009), Sixth International Conference on Fuzzy System and Knowledge Discovery, 402-406.
» CrossRef » Google Scholar » PubMed » DOAJ » CAS » Scopus
 | Fig. 1- Sample line without defect, a- Original line, b- After filtering by 2D-LMF |
 | Fig. 2- Sample line with defect, a- increasable section, b- defect in decreasable section |
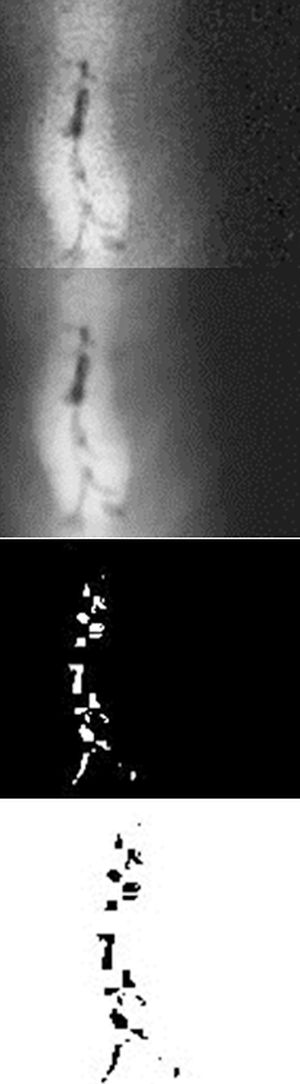 | Fig. 3- Sample image with defects. a- Original, b- after filtering by 2D-LMF, c and d- segmented defects |
 | Fig. 4- Sample image without defect. a- Original, b- after filtering by 2D-LMF, c- segmented defects |