ISSN : 0975-2927
EISSN : 0975-9166

DHANYA BIBIN1*, PUNITHA P.2
1People’s Education Society Institute of Technology, VTU, Bangalore, India.
2People’s Education Society Institute of Technology, VTU, Bangalore, India.
* Corresponding Author : dh.bibin@gmail.com
Received : 06-11-2011 Accepted : 09-12-2011 Published : 12-12-2011
Volume : 3 Issue : 4 Pages : 225 - 229
Int J Mach Intell 3.4 (2011):225-229
DOI : http://dx.doi.org/10.9735/0975-2927.3.4.225-229
Conflict of Interest : None declared
In this paper high-level image classes are inferred from low-level image features like color and shape features with the help of artificial neural network. Back propagation neural network algorithm is used for integrating knowledge from low-level image features and classify the images into high level concepts / semantic classes. The classifier is evaluated on a database of 1000 images from COREL database. The experimental results show that the accuracy using back propagation neural network algorithm to classify COREL images ranges between 80.5% to 88.6%.
CBIR, Image classification, Artificial neural networks(ANN), COREL database, Color histogram, Color moments, Color coherence vector, Edge direction histogram.
In today’s world, large collections of images are becoming available to the public, due to rapid development in digital imaging, storage and networking technologies. Organizing these collections of images (libraries) into categories and providing effective indexing is essential for “real-time” browsing and retrieval. This would necessitate developing schemes for indexing and categorizing the voluminous data. Image classification is the corner stone to several retrieval systems. For example, searching within a category is much more efficient than searching within the complete database. However, such category based searches are not possible even in the existing CBIR systems such as QBIC [1] , VIRAGE [2] and VISUALSEEK [3] . These systems are based on color histograms and texture of the image, where the user has to select colors from a palette and texture from a chart which correctly represents his query image. However it is difficult for the user to know the exact color and texture of the query image. Moreover for large databases with over thousands of images effective indexing becomes an important issue in content based image retrieval. A successful categorization of images into semantically meaningful categories based on low-level visual image features will greatly enhance the performance of content based image retrieval systems by filtering out images from irrelevant classes during matching.
Researchers have made considerable study on indoor/outdoor as well as city/landscape classifications. Most of their attempts have been to classify images by mapping low-level features to high-level semantics. Gorkani and Picard [4] classify images into photos of city scenes and photos of landscape scenes. They use multiscale steerable pyramid to find dominant orientations in 4 x 4 subblocks of images. The work by Vailaya et al. [5] is regarded as representative of the literature in the field. In their work they use global image features and classifying images using Bayesian framework. Szummer et al [6] proposed an algorithm for indoor/outdoor classification based on the K-NN classifiers and three types of features, i.e., histograms in Ohta color space (color feature), multiresolution autoregressive model parameters (texture feature) and coefficients of a shift-invariant DCT (frequency feature). Another attempt to solve this image indexing problem is the hierarchical indexing scheme proposed by Zhang and Zhong [7] which uses a self organizing map to cluster images into groups of similar images based on color and texture feature. Yiu [8] also uses the dominant orientations features and also color information to classify indoor outdoor scenes using K nearest neighbor and support vector machine classifiers. A novel approach for content based color image classification using Support Vector Machine (SVM) is addressed in [9] . The work of Weibao Zou et al [10] is based on wavelet and independent analysis component (ICA) for image classification with adaptive processing of data structures. A novel approach for semantic classification of images based on weighted feature support vector machine (WFSVM) is proposed in [11] . This paper takes the importance of each feature with respect to the classification task into account. Wai Yeung Yan et al in [12] investigates the use of wavelet decompose features for panchromatic image classification for the purpose of urban land-use mapping. In this study, a Very High Resolution IKONOS satellite image in panchromatic mode is used to examine the use of the DWT for image classification of urban areas.
This paper shows how a high level concept can be inferred from images using relatively simple low level features with the help of neural network classifiers. The proposed image classification system makes use of back propagation neural network classifier. This work is an attempt to reduce the semantic gap between the low-level image features and high-level image concepts. This study also uses combination of low level ‘color’ and ‘shape’ Image features and demonstrates that the classification accuracy improves when feature combinations are considered for classification. This study is done on a representative image database (COREL database) of 10 different semantic classes.
The paper is organized as follows. The image features used for classification are presented in Section 2. Section 3 discusses the Neural Network framework. The methodology used in this study is described in Section 4. Section 5 provides the method of performance evaluation. The experimental results are given in section 6, and Section 7 finally concludes the paper and presents directions for future research.
In order to classify images into meaningful classes, the first step is to extract the image features. This paper uses color and shape features to describe an image. The features used are Color Moments (CM), Color Histogram (CH) in HSV space, Color Coherence Vector (CCV) and Edge Direction Histogram (EDH). We are using CH in HSV space because HSV space is more intuitive way of describing color. In this the hue component is invariant to the changes in illumination and camera direction and hence more suited to image retrieval.
CM is the color distribution in an image and can be interpreted as a probability distribution. This probability distribution can be described by a set of moments. A moment is defined as
(1)
where k is order of the moment; CH of an image is produced first by discretization of the colors in the image into a number of bins, and counting the number of image pixels in each bin; CCV will incorporate spatial location of colors in an image. CCV is a color histogram refinement scheme that divides each bin into coherent and non coherent pixels [13] . A pixel in a bin is said to be coherent if it is part of a similarly colored region. An 8 neighbor connected component analysis is used to extract connected regions of the same color; the canny edge detector [14] is used to extract EDH from the images.
A neural network is a massively parallel-distributed processor made up of simple processing units, which has a natural property for storing experimental knowledge and making it available for use. Neural networks have become a very important method for image classification because of their ability to deal with uncertain, fuzzy, or insufficient data. ANN is an adaptive system that changes its structure based on external or internal information that flows through the network [15] .
Let x1, x2, x3,……xn be the inputs and w1, w2, w3…wn be the corresponding weights. The total input to the next neuron or the output neuron I is calculated by the summation function [16] using equation (2).
(2)
The result of the summation function, which is the weighted sum, is transformed to a working output through an algorithmic process called the activation function or the transfer function [16] . The output layer units often have linear activations, so that output activations equal net function values.
Multi Layer Perceptron (MLP) network architecture is used for training and testing. The MLP network consists of an input layer, one or more hidden layers, and an output layer. Each layer consists of multiple neurons. In this work, we the use architecture of the MLP network, which is the feed forward network with back propagation training algorithm (FFBP). In this type of network, the input is presented to the network and moves through the weights and nonlinear activation functions towards the output layer, and the error is corrected in a backward direction using the well-known error back propagation correction algorithm. After extensive training, the network will eventually establish the input-output relationships through the adjusted weights on the network. After training the network, it is tested with the dataset used for testing.
In this paper, to perform the analysis for image classification, the back propagation algorithm has been implemented using Matlab‘s Neural Network Pattern Recognition Tool (nprtool). Our classifier uses two-layer feed-forward back propagation network. Two-layer feed-forward network can be best defined as a network with sigmoid hidden and output neurons, which can classify vectors arbitrarily well. The network is trained with scaled conjugate gradient back propagation. To train the network, the input data and target data need to be fed into the network. The extracted color and shape features give the input data and the class label of images gives the target data. The network then divide the input sample data into three different samples which are training, validation and testing samples. The training samples are used to train the network, and the network is adjusted according to its error. The validation samples are used to measure network generalization, and to halt training when generalization stops improving. Testing samples are then used to provide an independent measure of the network performance during and after training. From the training window, the network’s performance can be observed and if the error of the network is still large, the network can be retrained back as to get more accurate and efficient result.
The performance of the designed classifier is measured in terms of accuracy. This term refers to the ability of the model to correctly predict the class label of new unseen data. Classification accuracy is calculated by determining the percentage of cases in which the test sets are correctly classified. Accuracy is the over-all recognition rate, and computed using equation (2). A good classification test always results with high values for accuracy.
(3)
COREL is a general purpose image database [17] consisting of 14500 images. For our experiment we have considered only 1000 images from the collection which are part of a total of 10 semantic categories with each class having 100 images each. These images are stored in JPEG format with size 384 x 256 or 256 x 384 and each image is represented in RGB color space. The 10 semantic classes are Africa(class 1), Beach(class 2), Buildings(class 3), Buses(class 4), Dinosaurs(class 5), Elephants(class 6), Flowers(class 7), Horses(class 8), Mountains(class 9) and Food(class 10).
The features (CH, EDH, CM, CCV) explained in section 2 were extracted for each image and these features were used to train the neural network classifier. For experimental purposes, 70% of the samples are taken for training, 15% of the samples are taken for validation and 15% of the samples are taken for testing the network. This study uses 20 hidden neurons to train the network. When all the parameters are confirmed, the network can be trained and the performance of the network can be observed after the training. The accuracy is computed in terms of MSE (Mean Squared Error) and %E (Percent Error). Mean squared error is the average squared difference between outputs and targets. Lower values are better, and zero means no error. Percent Error indicates the fraction of samples which are misclassified. A value of 0 means no miss-classifications, 100 indicates maximum miss-classification. In our study we performed repeated random sub-sampling approach in which we did four iterations and average accuracy is considered. The training set and test set do not contain the same images for each iteration. [Table-1] , [Table-2] and [Table-3] indicate the accuracies obtained for each iteration and also the average accuracy for single features CH, EDH and feature combination CH & EDH.
The experimental results show that, CH feature yielded an accuracy of around 80.5 % on the test set. EDH feature yielded an accuracy of around 61.7% on test set, and CCV gives an accuracy of 62.3% while the CM feature gives around 68.3% as shown in [Table-4] , and the graphical representation of [Table-4] is given in the [Fig-1] . These results show that the CH in HSV space yield a better accuracy than the remaining features and is suited for this particular classification problem.
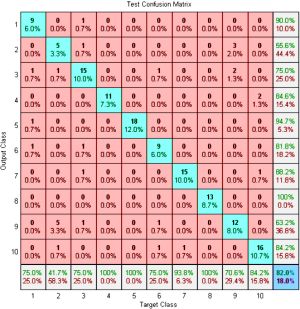
As can be observed in [Table-4] , the accuracy using CH feature alone is 86.68%. When the entire database is used for classification, each individual class result can be analyzed from the confusion matrix shown in [Fig-2] (which is drawn for the accuracies for iteration 2(see [Table-1] )). In the confusion matrix one can observe that the accuracy of classifying Horses (class 8) is 100% (see row 8, col 11 in [Fig-2] ), Beaches (class 2) is 55.6% (see row 2, col 11 in [Fig-2] ) and Mountains (class 9) is 63.2% (see row 9, col 11 in [Fig-2] ). This is because the color intensity and color distribution is not similar to all categories of images. This infers that CH feature is not suitable for all classes of images. This can be improved further by using feature combinations like EDH and CH as shown below.
Combining CH with EDH reduced the classification error and increased the classification accuracy and also has sufficient discrimination power on the image collection used in our experiments. Evaluation results when combining two features are shown in [Fig-4] . One can observe from the confusion matrix in [Fig-3] , (which is drawn for the accuracies for iteration 1(see [Table-3] ))combining CH and EDH, the accuracy of classifying the images into the classes ‘Beaches’ and ‘Mountains’ improves by ~20% each, and results with an overall accuracy of 93.2%.
As can be observed in [Fig-4] , the accuracy using CH and EDH feature is 93.2%. When the entire database is used for classification, each individual class result can be analyzed from the confusion matrix shown in [Fig-3] (which is drawn for the accuracies for iteration 1(see [Table-3] )). In the confusion matrix one can observe that the accuracy of classifying Africa (class 1) and Dinosaurs (class 5) are 100% (see row 1, col 11 and row 5, col 11 in [Fig-3] ), The accuracy of Beach(class 2) have now improved to 85.7% from 55.6% (see row 2, col 11 in [Fig-3] ), and Mountains (class 9) have improved to 82.4% from 63.2% (see row 9, col 11 in [Fig-3] ). This is because EDH provides the additional information of shape, and is able to differentiate images which have similar color intensity, which typically cannot be differentiated using Color features like CH, CM and CCV.
The accuracies obtained for different feature combinations are included in [Table-5a] [Table-5b] below. We can infer that the best accuracy is obtained for CH & EDH combination, and by having more than 2 features, there is no significant improvement in the accuracies.
This paper classifies the images into semantic classes using artificial neural networks which uses back propagation neural network algorithm. When single feature is used for classification the best classification accuracy obtained in this study is for CH at 86.68%, and for combination of the features, CH and EDH gave the best accuracy of 93.2% for the COREL database used in this study. The accuracy of the classifier depends on the feature set used, training samples selected and the classifier’s ability to learn from the training samples. This study utilizes the global features of images where the complete image is considered to derive the features. The classification accuracies can be significantly improved when the image is segmented and local features are extracted to derive the semantic classes. The neural network classifier used in this study provides good accuracies, however comparative study on alternate classifiers like SVMs, Bayesian, Genetic Algorithms, Rough set approach, Fuzzy set approaches were not in the scope of this study. Exploring these alternate classifiers could provide improved accuracies. This paper used a general database, COREL database with 10 semantic classes, however, more focused research can be conducted on a specific domain that could result in providing significant applications in that domain.
[1] Myron Flickner, Harpreet Sawhney (1995) IEEE Computer, 28(9), 23-32.
» CrossRef » Google Scholar » PubMed » DOAJ » CAS » Scopus
[2] Amarnath Gupta and Ramesh Jain (1997) Communications of the ACM, 40(5).
» CrossRef » Google Scholar » PubMed » DOAJ » CAS » Scopus
[3] Smith J.R., Chang S.F. (1996) In Proceedings of ACM Multimedia 96.
» CrossRef » Google Scholar » PubMed » DOAJ » CAS » Scopus
[4] Monika Gorkani and Picard R.W. (1994) In proc. Int. Conf. Pat. Rec., Volume 1, 459-464, Jerusalem, Israel.
» CrossRef » Google Scholar » PubMed » DOAJ » CAS » Scopus
[5] Vailaya A., Figueiredo M., Jain A. and Zhang H.J. (1999) In Proc. SPIE Conference Electronic Imaging ’99, (San Jose, CA).
» CrossRef » Google Scholar » PubMed » DOAJ » CAS » Scopus
[6] Szummer M. and Picard R.W. (1998) Proc. IEEE International Workshop on Content-based Access of Image and Video Databases. 42-51.
» CrossRef » Google Scholar » PubMed » DOAJ » CAS » Scopus
[7] Zhang H.J. and Zhong D. (1995) In Proc. SPIE Conference on Storage and Retrieval for Image and Video Databases, (San Jose, CA) 36–46.
» CrossRef » Google Scholar » PubMed » DOAJ » CAS » Scopus
[8] Elaine C Yiu. (1996) Master’s thesis, MIT, Dept of EECS.
» CrossRef » Google Scholar » PubMed » DOAJ » CAS » Scopus
[9] Agrawal S., Verma N.K., Tamrakar P., Sircar P. (2011) Information Technology: New Generations (ITNG), 1090 – 1094.
» CrossRef » Google Scholar » PubMed » DOAJ » CAS » Scopus
[10] Weibao Zou, Yan Li, King Chuen Lo, Zheru Chi. (2006) IJCNN, 3949 – 3954.
» CrossRef » Google Scholar » PubMed » DOAJ » CAS » Scopus
[11] Keping Wang, Xiaojie Wang, Yixin Zhong (2010) ICMTMA, 377 – 380.
» CrossRef » Google Scholar » PubMed » DOAJ » CAS » Scopus
[12] Wai Yeung Yan, Shaker, Weibao Zou A. (2009) IEEE Toronto International Conference, 456-461.
» CrossRef » Google Scholar » PubMed » DOAJ » CAS » Scopus
[13] Pass G. and Zabith R. (1996) IEEE Workshop on Applications of Computer Vision. 96-102.
» CrossRef » Google Scholar » PubMed » DOAJ » CAS » Scopus
[14] Canny J. (1986) IEEE Transactions on Pattern Analysis and Machine Intelligence, vol. PAMI-8, 689.
» CrossRef » Google Scholar » PubMed » DOAJ » CAS » Scopus
[15] Richard P. Lipmann. (1987) IEEE ASSP Magazine.
» CrossRef » Google Scholar » PubMed » DOAJ » CAS » Scopus
[16] Haykin S. (1999) Prentice Hall Upper Saddle River, New Jersey.
» CrossRef » Google Scholar » PubMed » DOAJ » CAS » Scopus
[17] Corel Data set. http://www.corel.com/products/clipartandphotos.
» CrossRef » Google Scholar » PubMed » DOAJ » CAS » Scopus
 | Fig. 1- Graphical Plot of Table-4 |
 | Fig. 2- Confusion matrix for 10 classes of images using CH. |
 | Fig. 3- Confusion matrix for 10 classes of images using CH and EDH |
 | Fig. 4- Evaluation results and graphical representation of the results when 2 features are used for classification. |
 | Table 1- Evaluation results for 4 iterations and average accuracy for CH feature |
 | Table 2- Evaluation results for 4 iterations and average accuracy for EDH feature |
 | Table 3- Evaluation results for 4 iterations and average accuracy when feature combination CH & EDH is used for Classification |
 | Table 4- Evaluation Results when Single Feature is used for Classification. |
 | Table 5a- Evaluation results when multiple features are used for classification |
 | Table 5b- Evaluation results when multiple features are used for classification |