ISSN : 0975-2927
EISSN : 0975-9166

MALLIKARJUNA P.B.1*, GURU D.S.2
1Department of Studies in Computer Science, Manasagangothri, University of Mysore, Mysore-570006, Karnataka, India
2Department of Studies in Computer Science, Manasagangothri, University of Mysore, Mysore-570006, Karnataka, India
* Corresponding Author : pbmalli@yahoo.com
Received : 06-11-2011 Accepted : 09-12-2011 Published : 12-12-2011
Volume : 3 Issue : 4 Pages : 204 - 211
Int J Mach Intell 3.4 (2011):204-211
DOI : http://dx.doi.org/10.9735/0975-2927.3.4.204-211
Conflict of Interest : None declared
In this paper, a new algorithm for segmentation of lesions on tobacco seedling leaves is proposed. Segmentation algorithm consists of mainly two steps. First step is to approximate lesion extraction using contrast stretching transformation and morphological operations such as erosion and dilation. Second step refines the outcome of first step by color segmentation using CIELAB color model. We have conducted a performance evaluation of segmentation algorithm by measuring the parameters such as Measure of overlapping (MOL), Measure of under-segmentation (MUS), Measure of over-segmentation (MOS), Dice similarity measure (DSM), Error-rate (ER), Precision (P) and Recall (R). Then first order statistical texture features are extracted from lesion area to detect and diagnose the disease type. These texture features are then used for classification purpose. A Probabilistic Neural Network (PNN) is employed to classify anthracnose and frog-eye spots present on tobacco seedling leaves. In order to corroborate the efficacy of the proposed model we have conducted an experimentation on a dataset of 1000 extracted areas of tobacco seedling leaves which are captured in an uncontrolled lighting conditions. Experimental results show that the proposed segmentation algorithm achieved best average DSM and MOL accuracy. The methodology presented herein effectively detected and classified the tobacco seedlings lesions upto an accuracy of 91.4412%. Further the recommended features are compared with Gray Level Co-occurrence Matrix (GLCM) based features to bring out their superiorities.
Image enhancement, CIELAB color model, Lesion area segmentation, Performance measures, Classification.
Agriculture plays an important role in economy of any nation. Economy of agricultural industries directly depends on the quality production. A stable agricultural industry ensures a country food security, source of income, source of employment. Therefore, to improve agricultural production and its quality, farmers should practice precision agriculture. Precision agriculture focuses on getting maximum quality output with minimum input. The objectives of precision agriculture are profit maximization, agriculture input rationalization and environmental damage reduction, by adjusting the agriculture practices to the site demands. To achieve these objectives some practices are to be adopted. Human intervention raises many disadvantages such as wrong diagnosis of diseases in crops, wrong quality analysis of crops, man power, labor cost and time consuming. Therefore, we need to automate these practices to increase profit using computer vision (CV) algorithmic models.
There is a tremendous pressure to reduce the use of pesticides and fungicides in modern crop production to decrease the environment impact of current practice and to lower production costs. Therefore, it is an essential that such sprays are applied only when and where needed. Disease control could be more efficient if lesion areas could be identified and spray applied only to the lesion areas. This demands mapping of lesion areas across crop field. This in turn requires detection of lesion areas and diagnosing lesion area to decide the type of a disease.
Diagnosis and detection of diseases at nursery stage is very important in any crop. The emergence and spreading of anthracnose and frog-eye spot lesions have become more common in tobacco at nursery (seedling) phase because of climate and environmental factors. The initial symptoms of anthracnose on a leaf are characterized by small circular water soaked brownish spots in large numbers as shown in [Fig-1] (a). The symptoms of frog-eye spots on a leaf are characterized by small spots of size 2mm with circular central grey or white dead tissue as shown in [Fig-4] (a). Apart from our work [1] no other attempt can be traced on disease detection on leaf of tobacco seedlings. However few attempts can be traced on other crops. Enhancing color differences in images by means of vectorial normalization was proposed to better separation of diseases [2] . Conversion of a RGB image into H, I3a, and I3b color transformation and segmenting the transformed image by analyzing the distribution of intensities in a histogram was explored to identify plant disease visual symptoms [3] . Color co-occurrence method (CCM) was used in conjunction with statistical classification algorithms to identify diseased and normal leaves under laboratory conditions [4] . An algorithm to classify fall armyworm damaged maize plants and an undamaged maize plant at simplified lighting conditions has also been recommended [5] . A back propagation neural network (BPNN) and a gray level co-occurrence matrix (GLCM) were used to evaluate the texture features of the lesion area in seedling diseases [6] . Fuzzy feature selection techniques are proposed for identifying diseases on cotton leaves [7] . Grading method of leaf spot disease on soya bean leaf using image processing techniques was proposed [8] . A method of recognizing disease in a cucumber leaf based on image processing and support vector machine was developed [9] . Digital image analysis and spectral reflectance data are used to quantify damage by greenbugs in wheat crop [10] . Severity of fungal disease in a spring wheat crop was estimated using hyperspectral crop reflectance data vectors and corresponding disease severity field assessments [11] . Fuzzy feature selection approach was proposed to diagnose and identify diseases in cotton crop. This approach reduces the dimensionality of the feature space so that it leads to a simplified classification scheme [12] . A method of using wavelet transform was developed to detect pests in stored grains [13] . An image processing algorithm was proposed for automatic identification of whiteflies, aphids and thrips in greenhouse. The size and color components were selected as features for automatic identification [14] .
In our previous work [1] , we segment the lesions on leaf of tobacco seedlings and classify them in to three classes: anthracnose, frog-eye spot and uninfected area. In our current work we improved the accuracy in segmenting the lesions on leaf in tobacco seedlings. We compared our current segmentation algorithm with previous segmentation algorithm by measuring the performance evaluation measures such as Dice coefficient (DC), Error-rate (ER), Measure of overlapping (MOL), Measure of under-segmentation (MUS), Measure of over-segmentation (MOS), Precision (P) and Recall (R).
The proposed segmentation algorithm consists of two steps. The first step involves approximate lesion extraction using contrast stretching transformation and morphological operations such as erosion and dilation. Second step refines the outcome of first step by color segmentation using CIELAB color model.
We propose the following method to segment the lesion area. The RGB image [Fig-1] (a) of anthracnose infected tobacco seedling leaf is transformed into a B-channel gray scale image [Fig-1] (b). The gray scale image is enhanced using a contrast stretching transformation [15] with an adjustable parameter (m) and is given by
G = f(g) = 1/[ 1 + (m / g)E ]
where,
g represents the intensities of the input image
m represents threshold
E controls the slope of the function (1)
The contrast stretching transformation compresses the values greater than into a narrow range of dark levels in the output image and similarly it compresses the values less than m into a narrow band of light levels in the output image. The enhanced gray scale image [Fig-1] (c) is transformed into a binary image using threshold T1. The erosion and dilation operations using a disk structuring element of radius one is applied on the obtained binary image [Fig-1] (d) to remove uninfected areas. A suitable threshold T2 is used to remove small uninfected areas left in [Fig-1] (e), i.e., the areas which are less than pixels are removed as shown in [Fig-1] (f). However, selecting a suitable threshold is a challenging task. If small threshold values are selected there are chances of retaining uninfected areas of small size and if large threshold values are selected there are chances of eliminating the lesion areas. Hence, fixing up a suitable threshold T2 such that there is a less probability for lesion areas for missing. [Fig-2] shows the extracted lesion areas of [Fig-1] (a). While extracting lesion areas we have considered k pixels around the seed point of lesions. However, selecting a suitable k value is a challenging task. If small k value is selected there is chance of losing lesion information and if large k value is selected there is chance of extracting adjacent lesions information.
From [Fig-2] it is observed that extracted lesions include lesion area and also healthy area. Therefore CIELAB color model is used to segment the lesion area from the healthy area. CIELAB is an approximately uniform color system. Its values are calculated by non-linear transformations of CIE XYZ. In this system, Y represents the brightness (or luminance) of the color, while X and Z are virtual (or not physically realizable) components of the primary spectra. The CIE XYZ tristimuli are standardized with values corresponding to the D65 white point: X0 = 95.047, Y0 = 100, Z0 = 108.883 It is then transformed into the standardized tristimuli to the CIELAB Cartesian coordinate system using the following metric lightness function.
(2)
The chromacity coordinates a and b are derived using:
a = 500 [ (X / X0)1/3 - (Y / Y0)1/3 ]
b = 200 [ (Y / Y0)1/3 - (Z / Z0)1/3 ] (3)
The chromacity coordinates represent opponent red-green scales (+ a red, - a greens) and opponent blue-yellow scales (+ b yellows, - b blues). Since color of the healthy area in the extracted lesions varies from light green to dark green, the chromacity coordinate a is used to segment lesion from the healthy area. The a value is calculated for each extracted lesion image pixel. If the value of a is greater than a predefined threshold then the corresponding pixel is considered as a lesion pixel else it is considered as a healthy pixel. Segmented anthracnose lesion areas of [Fig-2] using CIELAB color model are shown in [Fig-3] . The above algorithm is repeated for frog-eye infected leaf [Fig-4] Extracted and segmented frog-eye spot lesions are shown in [Fig-5] and [Fig-6] respectively.
Measuring the performance of a segmentation algorithm is necessary for two reasons: based on a performance metric, good parameter settings can be found for a segmentation algorithm and the performance of different segmentation approaches can be compared. The region based measures are used when the size and location measurement of the area of the object is essential and is the objective of the segmentation. Therefore, the following region based measures are used to evaluate the proposed segmentation algorithm.
This measure is also known as the area overlap measure (AOM) or the Jaccard similarity measure [16] and is defined as the ratio of the intersection of segmented lesion area S and ground truth lesion area G to the union of segmented lesion area S and ground truth area G. Measure of overlap (MOL) is given in equation 4. When the MOL is high, then the probability of segmentation performance is superior. Therefore MOL is expected to be high.
(4)
Where
S = Segmented area
G = Ground truth area
This measure is defined as the ratio of the unsegmented lesion area U and the ground truth lesion area G [16] . Measure of under segmentation (MUS) is given in equation 5. When the MUS is low, then the probability of segmentation performance is superior. Therefore MUS is expected to be low.
Where
U = Unsegmented lesion area
G = Ground truth area
U = |G - (S ∩ G)|
Where
S = Segmented area (5)
This measure is defined as the ratio of the segmented non-lesion area V and the ground truth area G [16] . Measure of over segmentation (MOS) is given in equation 6. When the MOS is low, then the probability of segmentation performance is superior. Therefore MOS is expected to be low.
Where
V = Segmented non-lesion area
S = Segmented lesion area (6)
V = |S-(S ∩ G)|
Where
G = Ground truth lesion area
Dice similarity measure (DSM) is derived from a reliability measure known as the kappa statistic [17] and computes the ratio of the intersection area divided by the mean sum of each individual area. Let S denote the segmented area and G denote the ground truth area. Then the Dice similarity measure (DSM) is defined as
(7)
When the DSM is high, then the segmentation is said to be superior. Therefore DSM is expected to be high.
The error rate ER is defined as the normalized agreement of segmentation results and the ground truth [17] . Let S denote the segmented area and G denote the ground truth area. The error rate ER is given in equation 8.
(8)
When the ER is low, then the segmentation is said to be superior. Therefore ER is expected to be low.
Precision is the fraction of segmented areas that are relevant to the query. It is given by
(9)
Recall is the fraction of the areas that are relevant to the query that are successfully segmented. It is given by
(10)
Lesion areas and uninfected areas are differed in terms of texture characterizations such as coarseness and smoothness. Therefore, we selected first order statistical texture features. The first order statistics estimate the properties of individual pixel values, ignoring the spatial interaction between image pixels [18] . First order statistical texture features are extracted from R-Channel of lesion areas of tobacco seedling leaf based on statistical measure of the intensity histogram. This measure is based on statistical moments, uniformity and entropy. Four texture features: smoothness, third moment, uniformity and entropy are extracted from lesion areas and selected uninfected areas. These features are employed to classify tobacco seedling diseases. Mathematical formulations of texture features are referred in [15] .
The features mentioned in section 4 are extracted from the segmented lesion areas. In order to classify the lesion areas into anthracnose or frog-eye spot disease, Probabilistic Neural network (PNN) has been used in this work. The reason in selecting PNN is that it has good generalization properties. In addition, it takes less time to train the system such that it works much faster than back propagation artificial neural networks.
Images of tobacco leaves in colour are acquired using a Sony digital colour camera in an uncontrolled real tobacco field. The colour signals from the camera are transferred as a 24 bit RGB colour image data (1632 × 1224) using a personal computer. The leaves used for imaging are randomly selected from the tobacco seedling bed at Central Tobacco Research Institute (CTRI), Hunsur, Karnataka, India and captured at uncontrolled lighting condition. A total of 950 areas are extracted from 120 infected leaves of tobacco seedlings using the segmentation algorithm proposed in section 2. Out of 950 extracted areas, 500 are of anthracnose, 400 are of frog-eye spot and remaining 50 are of uninfected. In order to conduct a robust experimentation we have extracted 50 more uninfected areas manually. Therefore, a total of 1000 extracted areas are used in this work. To set up the threshold values of parameters T1, T2, and k, we conducted experimentation by varying the values of parameters. Experimentally it is found that the values of T1, T2, and k are 0.5, 60, 200 and 25 respectively. i.e., for these values proposed segmentation algorithm has achieved best segmentation performance results.
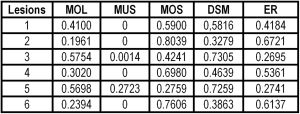
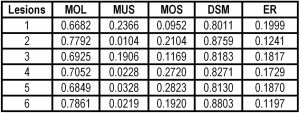
The segmentation performance is calculated based on the comparison between the manually segmented ground truth G for lesion area and segmentation result S generated by the image segmentation approach. In order to corroborate the efficacy of the proposed segmentation algorithm, six performance measures such as Measure of overlapping (MOL), Measure of under-segmentation (MUS), Measure of over-segmentation (MOS), Dice similarity measure (DSM), Error-rate (ER), Precision (P) and Recall (R) are calculated for 500 segmented areas of 70 anthracnose infected tobacco leaves and 400 segmented areas of 50 frog-eye spot infected tobacco seedling leaves. Segmentation performance results of proposed segmentation algorithm and the existing segmentation algorithm [1] for representative sample of anthracnose infected tobacco leaf shown in [Fig-1] (a) are tabulated in [Table-1] and [Table-2] respectively. Average segmentation performance results of 500 extracted lesions of anthracnose infected leaves for both proposed segmentation algorithm and the existing segmentation algorithm [1] are calculated and tabulated in [Table-3] . Segmentation performance results of proposed segmentation algorithm and the existing segmentation algorithm [1] for representative sample of anthracnose infected tobacco leaf shown in [Fig-4] (a) are tabulated in [Table-4] and [Table-5] respectively. Average segmentation performance results of 400 extracted lesions of frog-eye infected leaves for both proposed segmentation algorithm and the existing segmentation algorithm [1] are calculated and tabulated in [Table-6] . A segmentation algorithm is said to be superior when performance parameters MOL, DSM, Precision and Recall are high and MUS, MOS and ER are low. From [Table-3] and [Table-6] it is understood that the proposed segmentation algorithm has achieved high value for MOL, DSM, Precision and Recall and low value for MUS, MOS and ER when compared to the existing segmentation algorithm [1] extracted areas are classified into three classes: anthracnose, frog-eye spot and uninfected using the PNN Classifier. We have varied the training set by 40%, 50% and 60% and the remaining samples of each class for testing purpose. Experiment has been conducted 20 times (20 trails), each time selecting specified number of samples for training and testing samples randomly. For each trail, we have calculated the classification accuracy. Average classification accuracy, minimum classification accuracy and maximum classification accuracy of 20 trails are calculated in experiment. In order to demonstrate the performance of the recommended features we have conducted a comparative analysis using another texture feature extraction method called Gray Level Co-occurrence Matrix (GLCM) [19] . The GLCM is a tabulation of how often different combinations of gray levels co-occur in an image or image section. The GLCM is a N×N square matrix, where N is the number of different gray levels in an image. An element p (i, j, d, θ) of a GLCM of an image represents the relative frequency, where i is the gray level of the pixel p at location (x, y), and j is the gray level of a pixel located at a distance d from p in the orientation θ. In this work the texture features such as contrast, homogeneity, energy and correlation are extracted. The GLCM estimates image properties related to second-order statistics which considers the relationship among pixels or groups of pixels (usually two), whereas, pixels on lesion areas have no spatial relationship and hence first order statistical texture features will give better results than GLCM. The classification results using GLCM and first order statistical texture features are given in [Table-7] . [Table-7] indicates that first order statistical texture features achieves a significant improvement in classification accuracy over GLCM. Confusion matrix of tobacco seedling diseases for first order statistical texture features is given in Table 8 with precision, recall and F measure.
In this work a model for segmenting lesions in tobacco seedlings has been developed. Lesion areas are segmented efficiently using image enhancement, dilation and erosion operations and color segmentation using CIELAB color model. Proposed segmentation algorithm has evaluated by performance measures. Proposed segmentation algorithm is superior when compared to the existing algorithm [1] . The experimental results have shown that the first order statistical texture features outperform the Gray level co-occurrence matrix features. In future we will extend this work to other tobacco seedlings diseases.
[1] Guru D.S., Mallikarjuna P.B. and Manjunath S. (2011) COMPUTE '11 Proceedings of the Fourth Annual ACM Bangalore Conference, Published by ACM NewYork, Ny, USA article no. 32.
» CrossRef » Google Scholar » PubMed » DOAJ » CAS » Scopus
[2] Vizhanyo T., and Felfoldi J. (2000) Computers and Electronics in Agriculture, vol. 26, pp. 187-198.
» CrossRef » Google Scholar » PubMed » DOAJ » CAS » Scopus
[3] Camargo A., and Smith J.S. (2009) Biosystem Engineeing, vol. 102, pp. 9-21.
» CrossRef » Google Scholar » PubMed » DOAJ » CAS » Scopus
[4] Pydipati R., Burks T.F., and Lee W.S. (2006) Computers and Electronics in Agriculture, vol. 52, pp. 49-59.
» CrossRef » Google Scholar » PubMed » DOAJ » CAS » Scopus
[5] Sena D.G., and Pinto F.A.C. (2003) Biosystem Engineeing, vol. 85(4), pp. 449-454.
» CrossRef » Google Scholar » PubMed » DOAJ » CAS » Scopus
[6] Huang K. (2007) Computers and Electronics in Agriculture, vol. 57, pp. 3-11.
» CrossRef » Google Scholar » PubMed » DOAJ » CAS » Scopus
[7] Zhang Y., Mao H., Hu B., and Li M. (2007) Proceedings of the 2007 International conference on Wavelet Analysis and Pattern Recognition, pp. 124 – 129.
» CrossRef » Google Scholar » PubMed » DOAJ » CAS » Scopus
[8] Weizheng S., Yachun W., Zhanliang C. and Hongda W. (2008) International Conference on Computer Science and Software Engineering, pp. 491-494.
» CrossRef » Google Scholar » PubMed » DOAJ » CAS » Scopus
[9] Youwen T., Tianlai L., and Yan N. (2008) Congress on Image and Signal Processing, pp. 262-267.
» CrossRef » Google Scholar » PubMed » DOAJ » CAS » Scopus
[10] Mirik M., Michels Jr, G.J., Kassymzhanova-Mirik S., Elliott N.C., Catana V., Jones D.B., and Bowling R. (2005) Computers and Electronics in Agriculture, vol. 51, pp. 86-98.
» CrossRef » Google Scholar » PubMed » DOAJ » CAS » Scopus
[11] Muhammed H.H. (2005) Biosystem Engineeing, vol. 95(1), pp. 9-20.
» CrossRef » Google Scholar » PubMed » DOAJ » CAS » Scopus
[12] Zhang Y.C., Mao H.P., Hu B., and Li M.X. (2007) International Conference on Wavelet Analysis and Pattern Recognition, pp. 124-129.
» CrossRef » Google Scholar » PubMed » DOAJ » CAS » Scopus
[13] Zhou L. and Tong X.J. (2008) Seventh International Conference on Machine Learning and Cybernetics, pp. 2790-2793.
» CrossRef » Google Scholar » PubMed » DOAJ » CAS » Scopus
[14] Cho J., Choi J., Qiao M., Ji C., Kim H., Uhm K. and Chon T. (2007) International Journal of Mathematics and Computers in Simulation, vol. 1(1), pp. 46-53.
» CrossRef » Google Scholar » PubMed » DOAJ » CAS » Scopus
[15] Gonzalez R.C., Woods R.E. and Eddins S.L. (2007) Pearson Education.
» CrossRef » Google Scholar » PubMed » DOAJ » CAS » Scopus
[16] Elter M., Held C. and Wittenberg T. (2010) Physics in Medicine and Biology, vol. 55, pp. 5299 – 5315.
» CrossRef » Google Scholar » PubMed » DOAJ » CAS » Scopus
[17] Yuan X., Situ N. and Zouridakis G. (2009) Pattern Recognition, vol. 42, pp. 1017 – 1028.
» CrossRef » Google Scholar » PubMed » DOAJ » CAS » Scopus
[18] Srinivasan G.N. and Shobha G. (2008) Proceedings of World Academy of Science, Engineering and Technology, vol. 36, pp. 1264-1269.
» CrossRef » Google Scholar » PubMed » DOAJ » CAS » Scopus
[19] Haralick R.M., Shanmugam and Dinstein I. (1973) IEEE Transaction on System, man and Cybermatics, Vol. 3, No. 6. pp. 610 – 621.
» CrossRef » Google Scholar » PubMed » DOAJ » CAS » Scopus
 | Fig. 1- a to f Segmentation of anthracnose lesion areas on a tobacco seedling leaf |
 | Fig. 2- Extracted anthracnose lesion areas of Fig. 1a |
 | Fig. 3- Segmented anthracnose lesion areas of Fig. 2 using CIELAB color model |
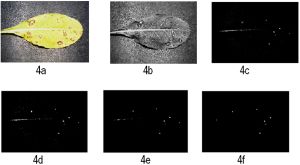 | Fig. 4- a to f Segmentation of frog-eye spot lesion areas on a tobacco seedling leaf |
 | Fig. 5- Extracted frog-eye spot lesion areas of Fig. 4a |
 | Fig. 6- Segmented Frog-eye spot lesion areas of Fig. 5 using CIELAB color model |
 | Table 1- Segmentation performance results of proposed segmentation algorithm for representative sample of anthracnose infected leaf shown in Fig. 1a: |
 | Table 2- Segmentation performance results of the existing segmentation algorithm [1] for representative sample of anthracnose infected leaf shown in Fig. 1a: |
 | Table 3- Performance results of proposed segmentation algorithm and the existing segmentation algorithm [1] for anthracnose infected leaves: |
 | Table 4- Segmentation performance results of proposed segmentation algorithm for representative sample of frog-eye spot infected leaf shown in Fig. 4 (a): |
 | Table 5- Segmentation performance results of the existing segmentation algorithm [1] for representative sample frog-eye spot infected leaf shown in Fig. 4a: |
 | Table 6- Performance results of proposed segmentation algorithm and the existing segmentation algorithm [1] frog-eye spot infected leaves: |
 | Table 7- Classification results of tobacco seedling diseases |